> ## Documentation Index
> Fetch the complete documentation index at: https://docs.findly.ai/llms.txt
> Use this file to discover all available pages before exploring further.

# Visualizing Your Results

> Explore how Findly's data visualization tools help you interpret query results through user-friendly graphical formats.

## Visualizing Your Data

<Tip>
  Customize your visualizations via the dashboard for enhanced data
  interpretation.
</Tip>

### Step 1

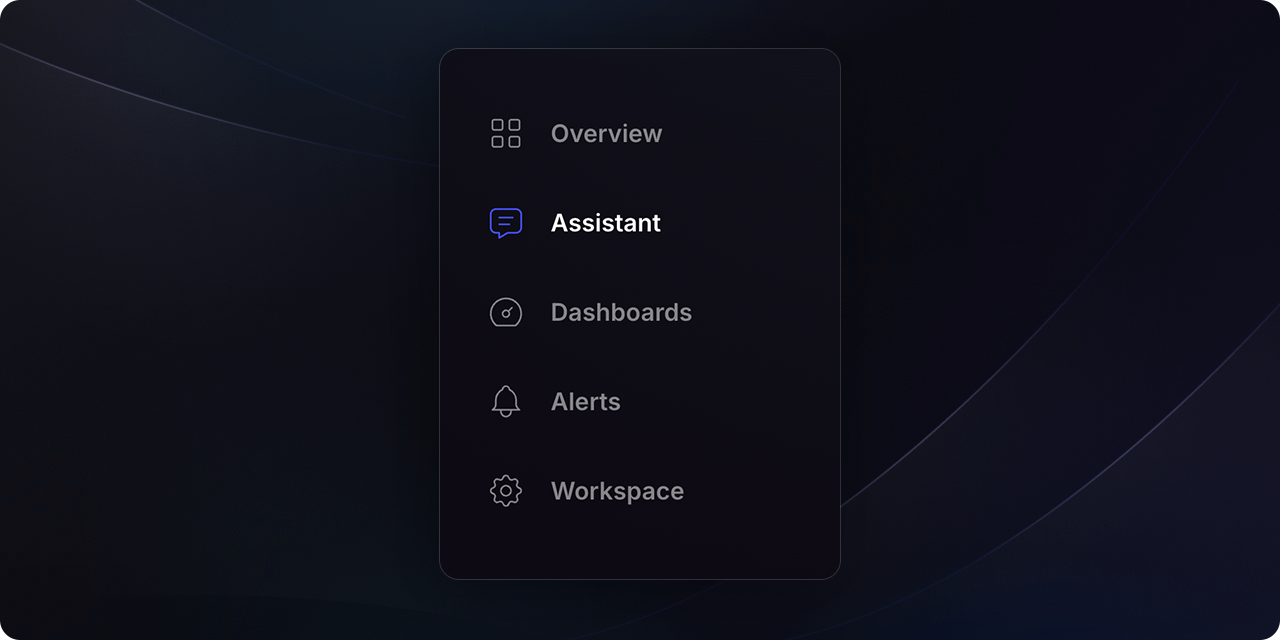
Navigate to the `Assistant` section and ask your desired question.

<Frame>
  <img src="https://mintcdn.com/findly/1xEknXya6BSPSEwM/docs/app/usage/assets/screen-nav-assistant.png?fit=max&auto=format&n=1xEknXya6BSPSEwM&q=85&s=4ba7d66459fc2b5d6f96ac8ebb33a0c8" width="1280" height="640" data-path="docs/app/usage/assets/screen-nav-assistant.png" />
</Frame>

<br />

<Warning>
  Ensure the metric layer is configured beforehand. For more details, refer to
  the metrics sections.
</Warning>

### Step 2

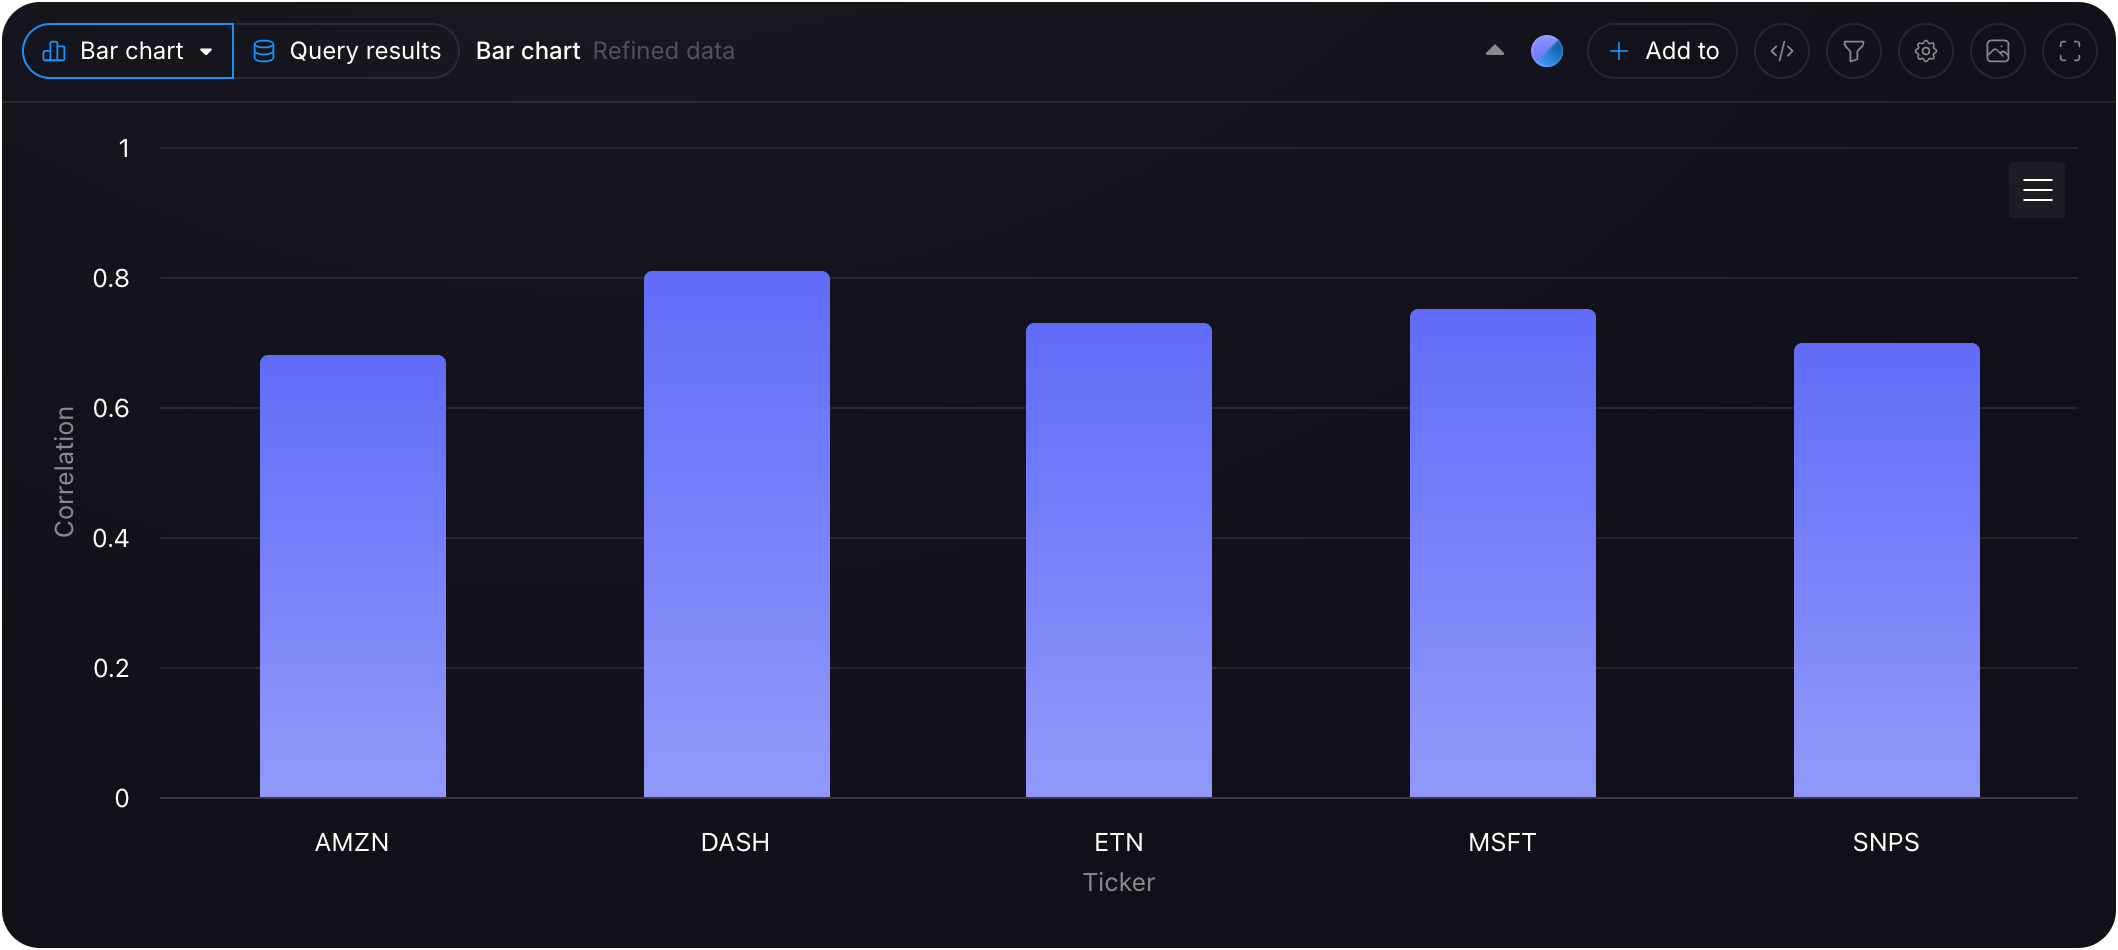
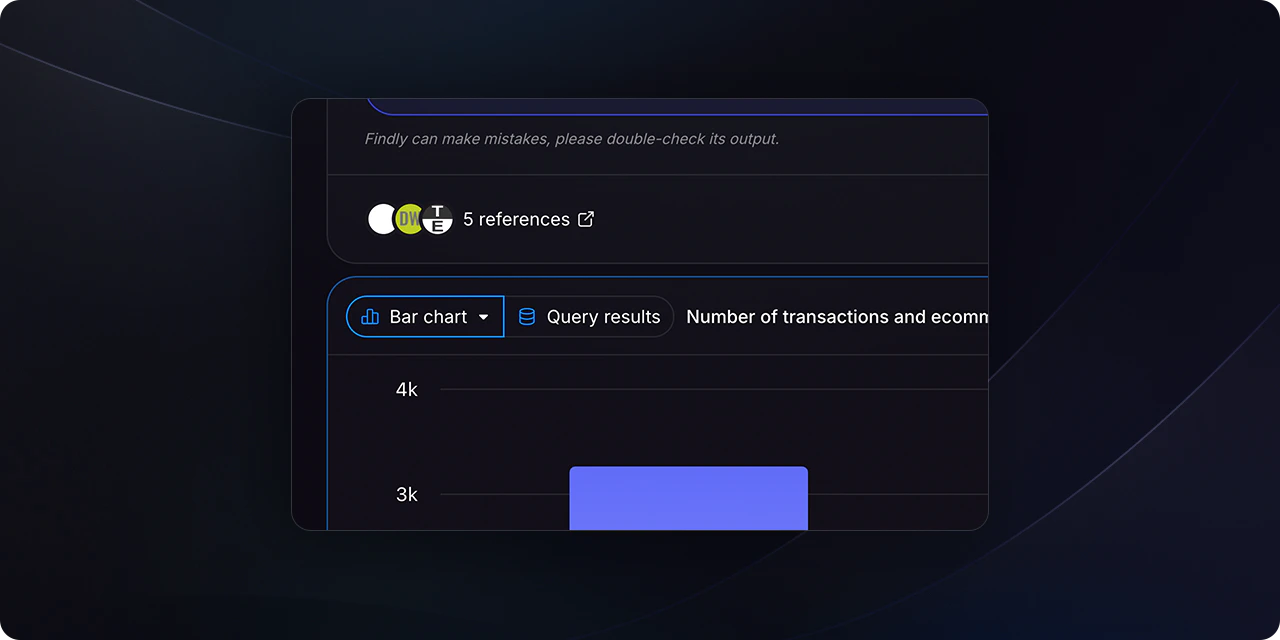
After Findly generates the results, you can change the visualization type using the selector located at the top-right of the table.

<Frame>
  <img src="https://mintcdn.com/findly/1xEknXya6BSPSEwM/docs/app/usage/assets/screen-visualization-select.png?fit=max&auto=format&n=1xEknXya6BSPSEwM&q=85&s=52bf5707f54b44894105391c9cb866cb" width="1280" height="640" data-path="docs/app/usage/assets/screen-visualization-select.png" />
</Frame>

### Step 3

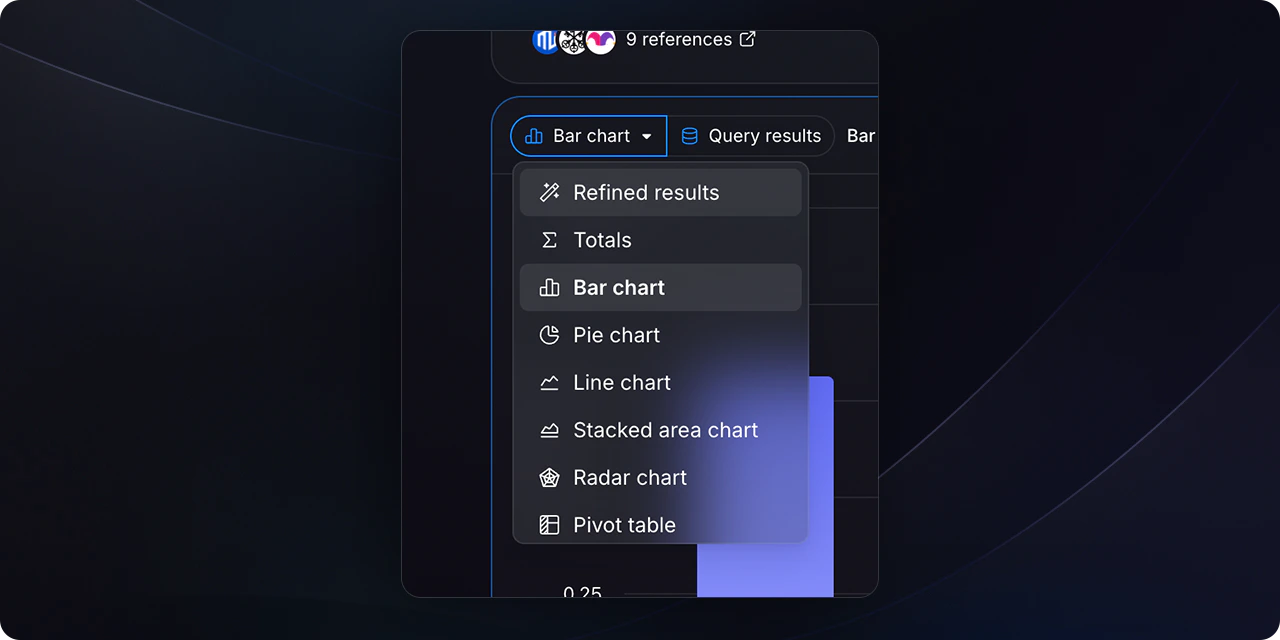
Select your preferred visualization type (e.g., bar chart, pie chart, line graph) from the dropdown menu.

<Frame>
  <img src="https://mintcdn.com/findly/1xEknXya6BSPSEwM/docs/app/usage/assets/screen-visualization-select-open.png?fit=max&auto=format&n=1xEknXya6BSPSEwM&q=85&s=0ab411d2ced6b2984eae500224a1945f" width="1280" height="640" data-path="docs/app/usage/assets/screen-visualization-select-open.png" />
</Frame>

<br />

{" "}

<img src="https://mintcdn.com/findly/1xEknXya6BSPSEwM/docs/app/usage/assets/screen-bar-chart.png?fit=max&auto=format&n=1xEknXya6BSPSEwM&q=85&s=ade9c1ee7c5873d59feda0c88d37cb20" width="2118" height="950" data-path="docs/app/usage/assets/screen-bar-chart.png" />
